In 2022, Finland’s total energy consumption decreased by five per cent compared to the previous year.
Image 1. The share of renewable energy sources of the total energy consumption in Finland was 41.8% in 2022. Fossil fuels and peat accounted for 33.7% of the total consumption, and nuclear energy for 20.4%. In 2022, net imports were 3.5% of the total energy consumption. The consumption of natural gas nearly halved from the previous year after its supply from Russia stopped in May.
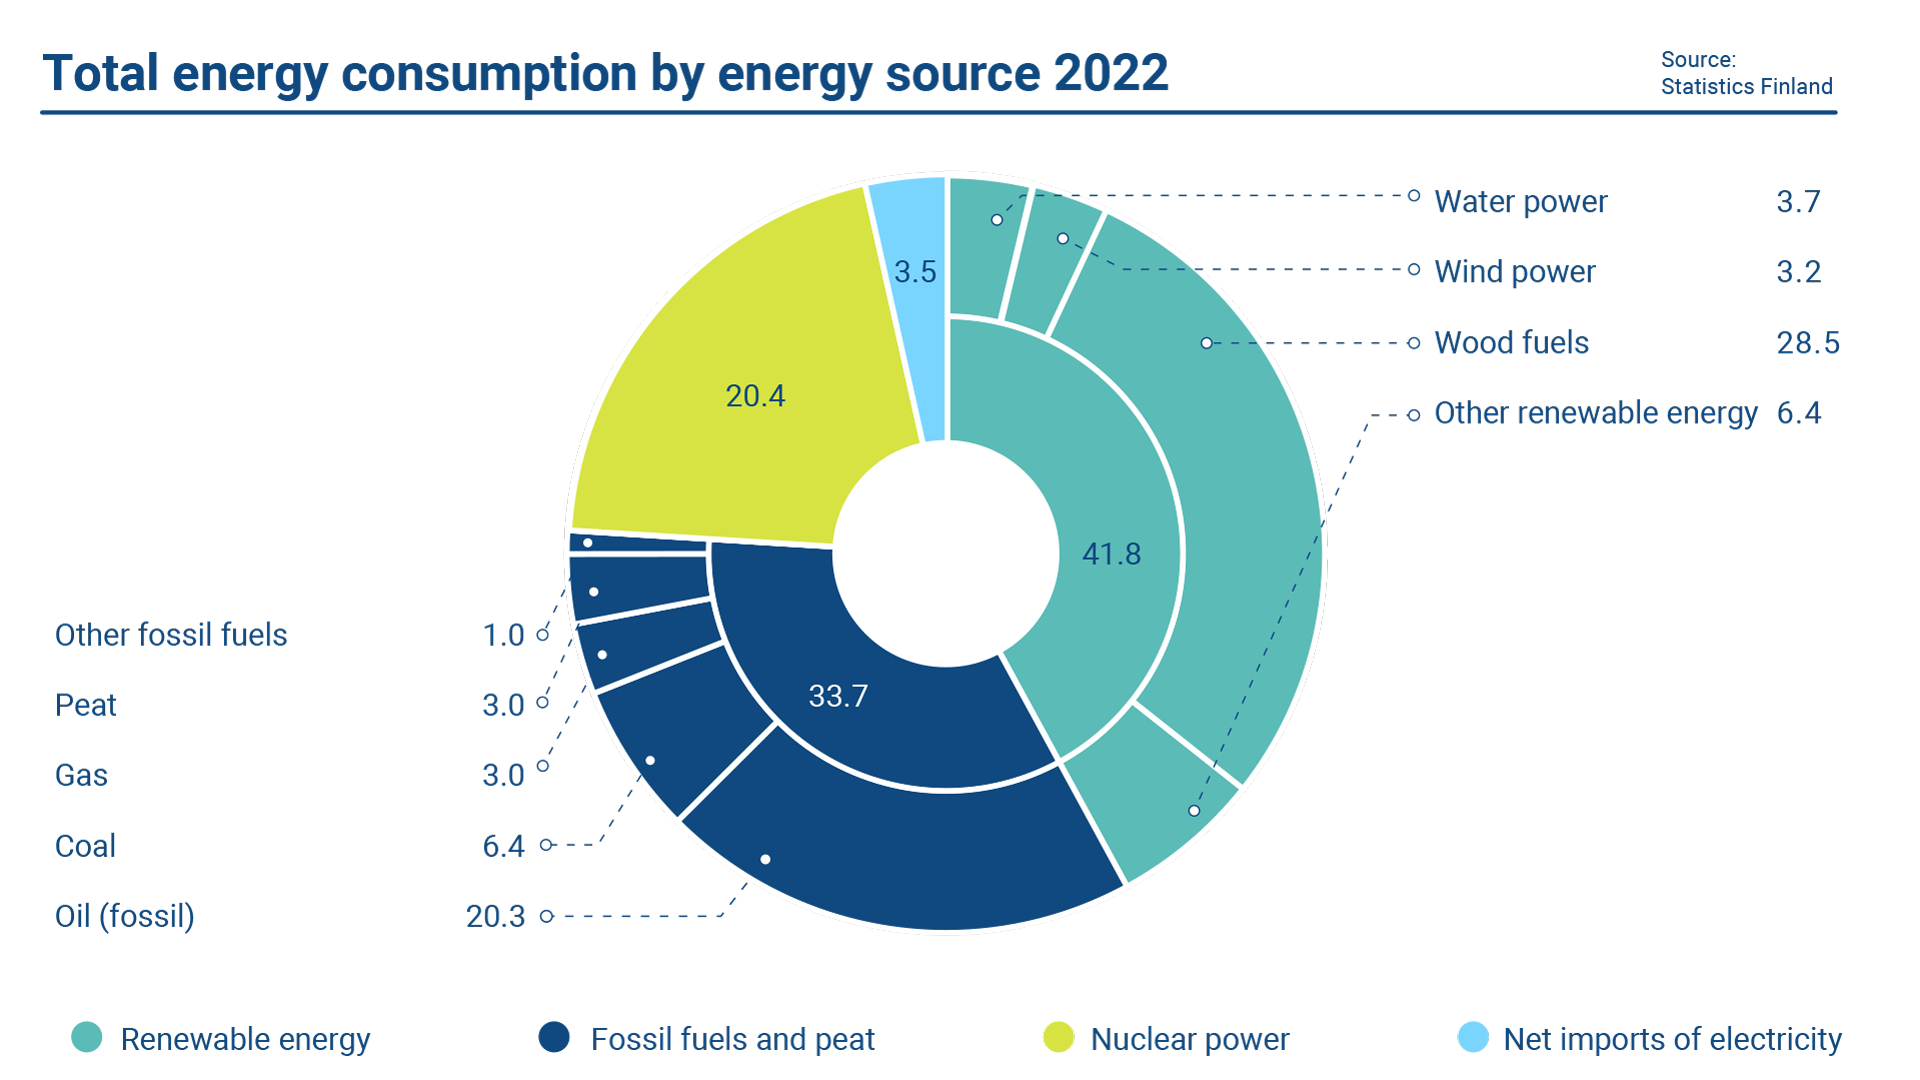
Image 2. In 2020s, renewable energy sources surpassed fossil fuels in Finland’s total energy production. In 2022, the difference between the share of renewable energy and share of fossil fuels grew to 8 percentage points.
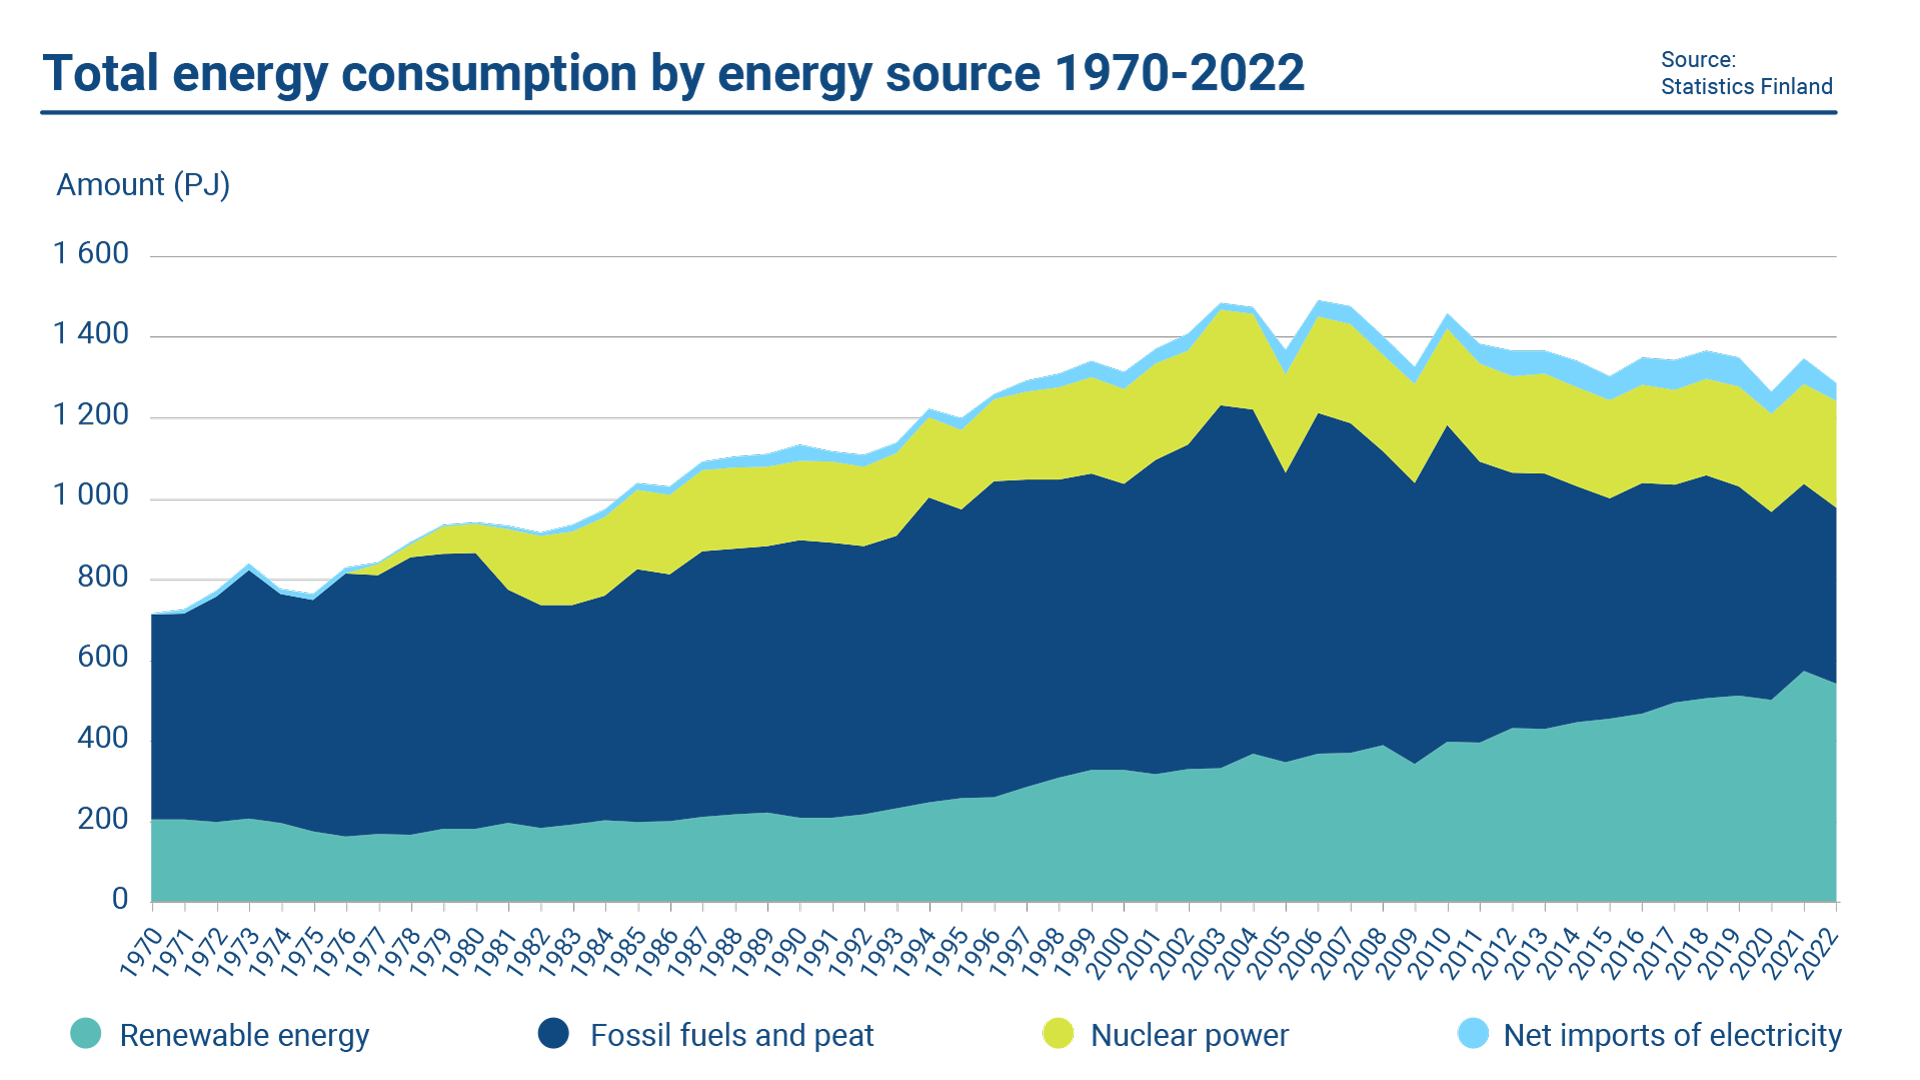
Image 3. In 2022, the share of industry of the final energy consumption of Finland was 44.8%. In EU comparison, the share is quite high. Heating accounted for 27.1% and transport for 15.5% of the final energy consumption.
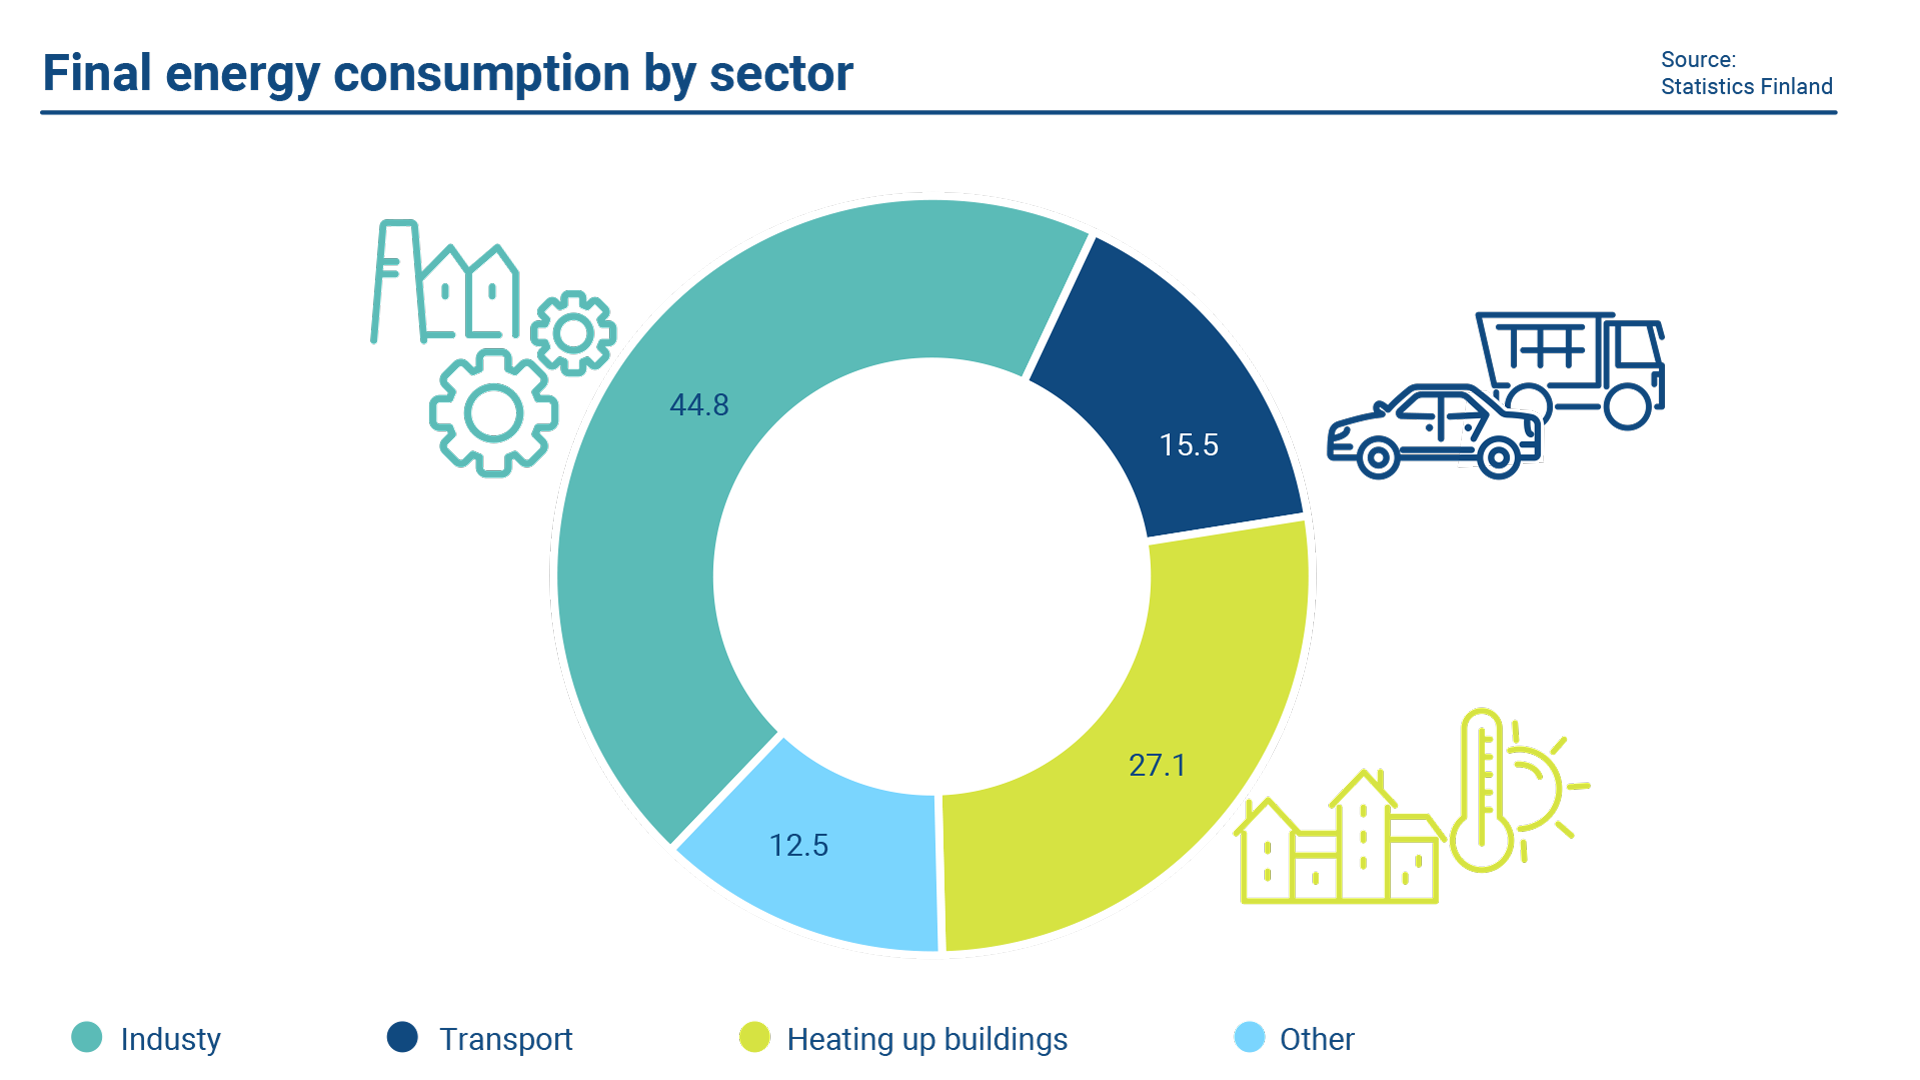
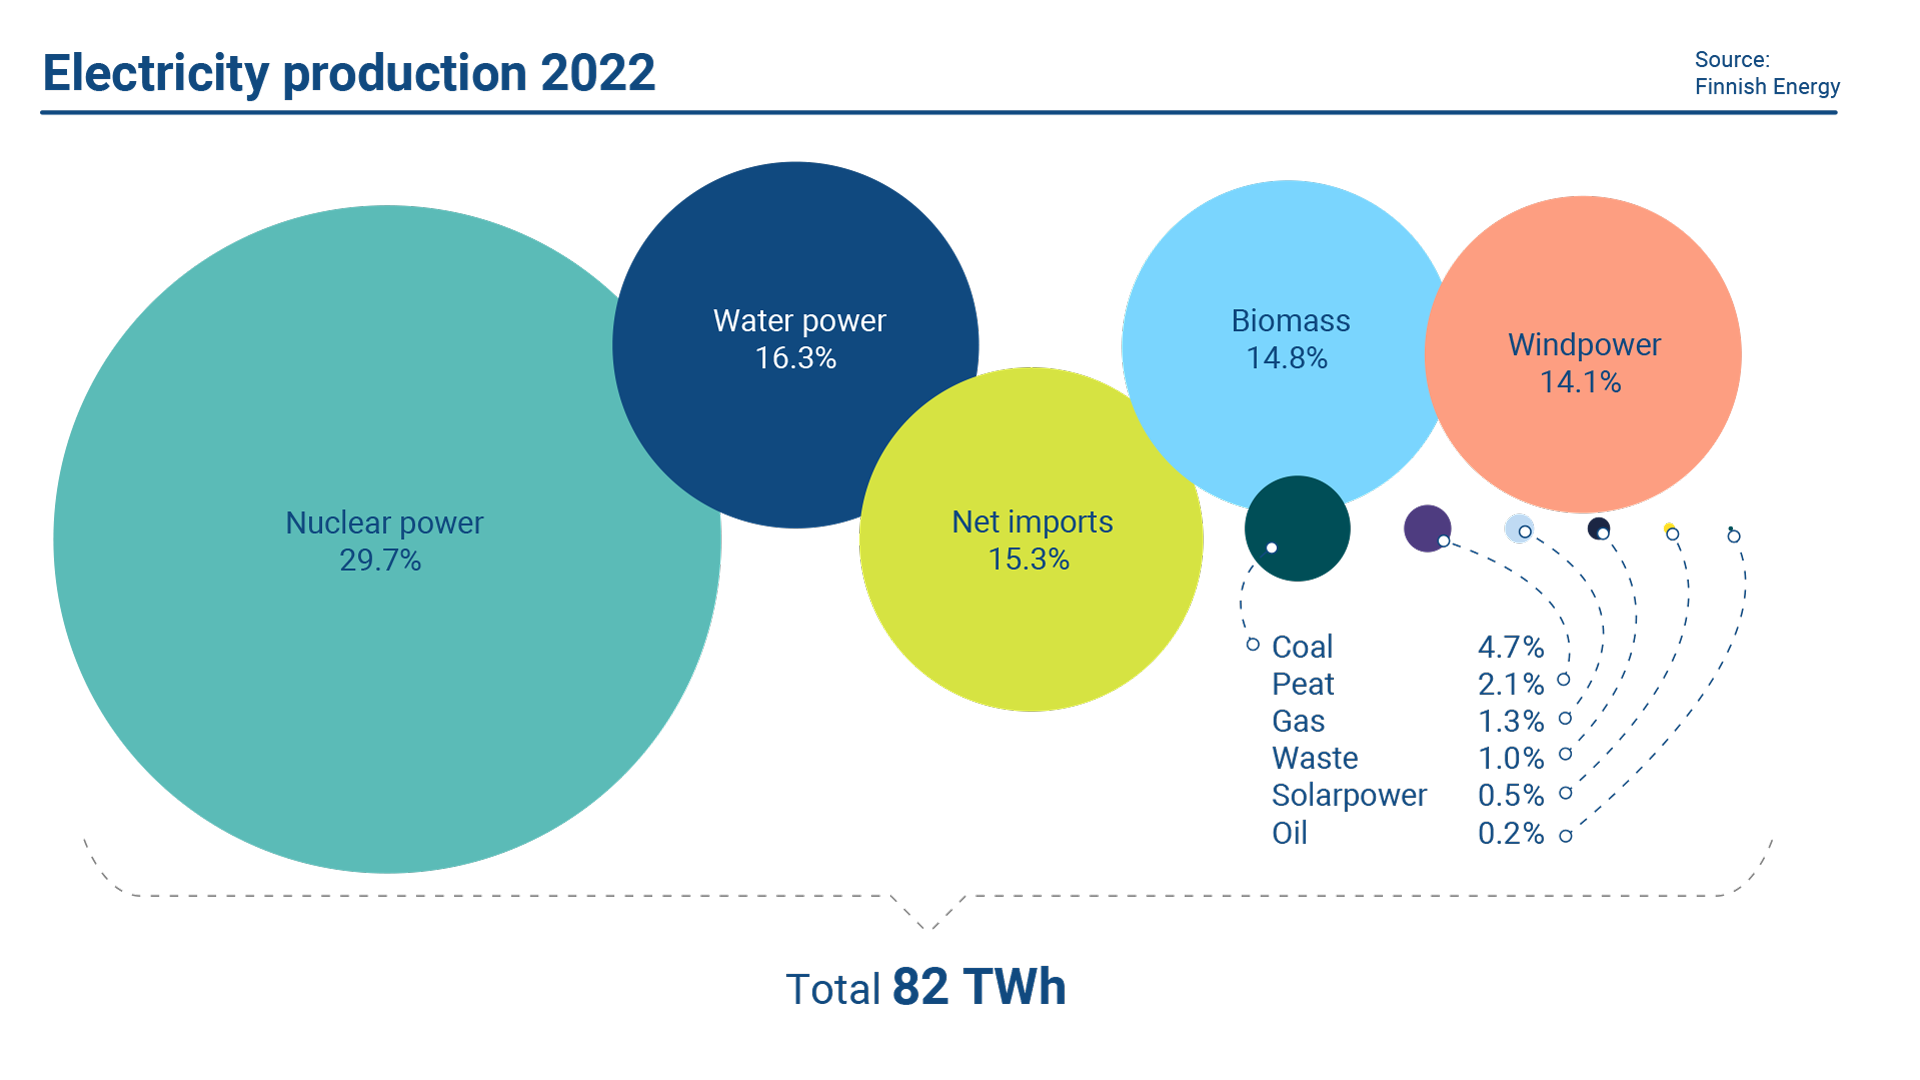
Image 4. In Finland, 89% of electricity was fossil free in 2022. Finland’s wind power capacity has increased rapidly in recent years and in 2022, wind power production covered 14.1% of Finland’s electricity production. Nuclear power production grew in 2022 as the new Olkiluoto 3 plant unit was plugged into the national grid in March.